This quick guide walks you through the process of visualizing temperature and inductive sensor data in Grafana using InfluxDB2. The sensors are connected to the expansion modules RevPi AIO and RevPi DIO. By using the Python library Revpimodio, the modules can be easily programmed in Python to successfully transfer data to InfluxDB2. Follow the steps below to effectively collect, store, and visualize your data in Grafana.
Background #
Integrating InfluxDB and Grafana on a RevPi Connect 4 allows real-time monitoring of data to gain important insights into environmental conditions, for example.
InfluxDB and the Grafana frontend run on a RevPi Connect 4. The sensors are connected to the RevPi AIO and RevPi DIO modules. Using the Python library "Revpimodio," sensor values can be read from the modules and sent to an InfluxDB bucket. In this case, InfluxDB version 2 is used.
In InfluxDB 2, buckets are used instead of databases. A bucket is a container for time-series data that allows organizing and isolating data. These buckets are used to store the collected data.
Grafana, on the other hand, is a web frontend for creating data dashboards and is often used for real-time server analysis. It can utilize a variety of data sources but works particularly well with InfluxDB.
Prerequisites #
Hardware #
-
RevPi Connect 4
-
Inductive proximity sensor (3 wires, PNP)
-
PT-1000 temperature sensor (4 wires)
-
Connection cables (for wiring the RevPi DIO and the LED).
Software #
-
InfluxDB2
-
Grafana
System Setup #
Follow these steps to configure your system. For detailed instructions, refer to the Getting Started guide.
-
Power Up the RevPi Connect 4
▷ Connect the RevPi Connect 4 to a power source.
▷ Ensure it is connected to your local network for accessibility.
-
Power Up the RevPi DIO and Revpi AIO
▷ Power on the RevPi DIO.
▷ Power on the RevPi AIO.
-
Verify Connections
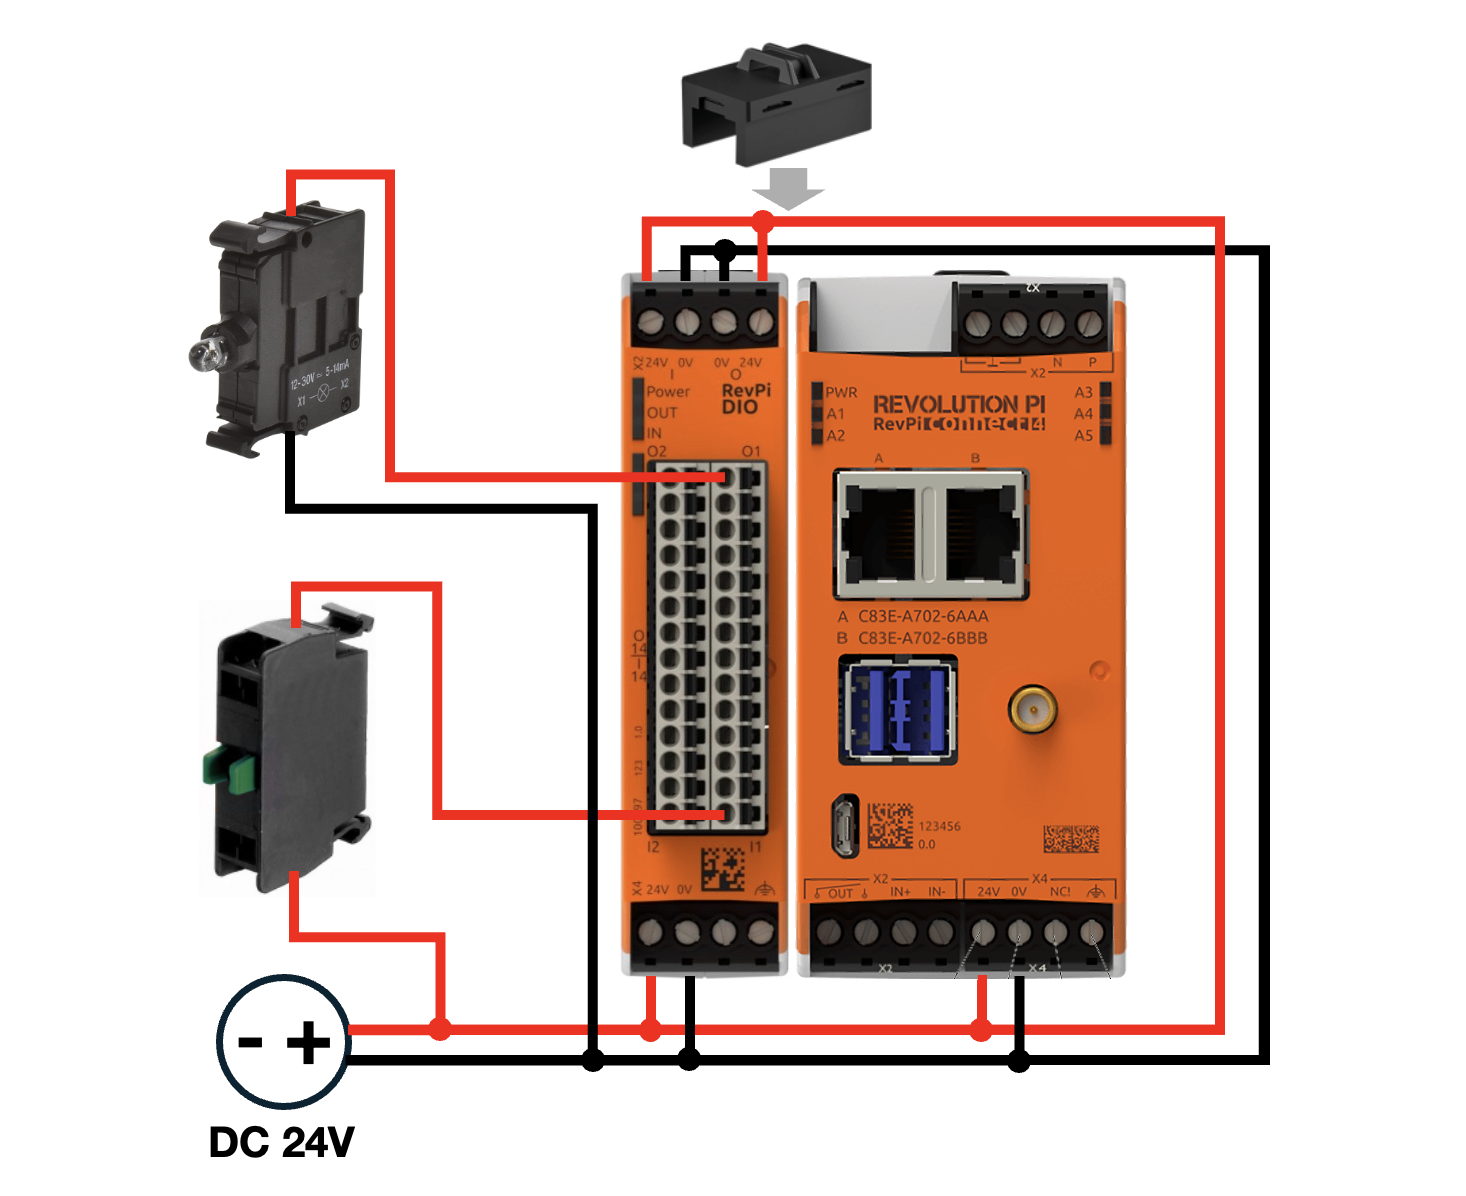
▷ Check that the Inductive proximity sensor is properly connected to the RevPi DIO.
▷ Ensure the RevPi DIO and RevPi AIO are securely connected to the RevPi Connect 4 via the PiBridge interface.
▷ Connect the PT-1000 to the RTD channel 1 of the RevPi AIO.
-
Access the RevPi Interface
▷ Open a web browser on a device connected to the same network.
▷ Access the RevPi system using its IP address.
|
Note
|
For network troubleshooting or determining the IP address of your RevPi, see Establish a Network Connection. |
Overview #
-
Setup and Installation
-
Setting up the RevPi Connect 4 and expansion modules (RevPi DIO, RevPi AIO)
-
Installing InfluxDB2
-
Installing Grafana
-
Configuring InfluxDB2 and Grafana
-
-
Logging data in the InfluxDB2 database
-
Setting up the database and buckets in InfluxDB2
-
Configuring the Python script to capture and transfer data from the sensors to InfluxDB2
-
-
Visualizing temperature and inductive sensor status with InfluxDB2 and Grafana
-
Integrating InfluxDB2 with Grafana
-
Creating dashboards in Grafana to visualize temperature and sensor status data
-
Customizing and optimizing dashboards for clear data representation
-
Step 1: Setting up the RevPi Connect 4 and Expansion Modules (RevPi DIO, RevPi AIO) #
For this demo, please use a 64-bit RevPI Image, as InfluxDB2 is only compatible with a 64-bit operating system.The images are available on the Revolution Pi download area. |
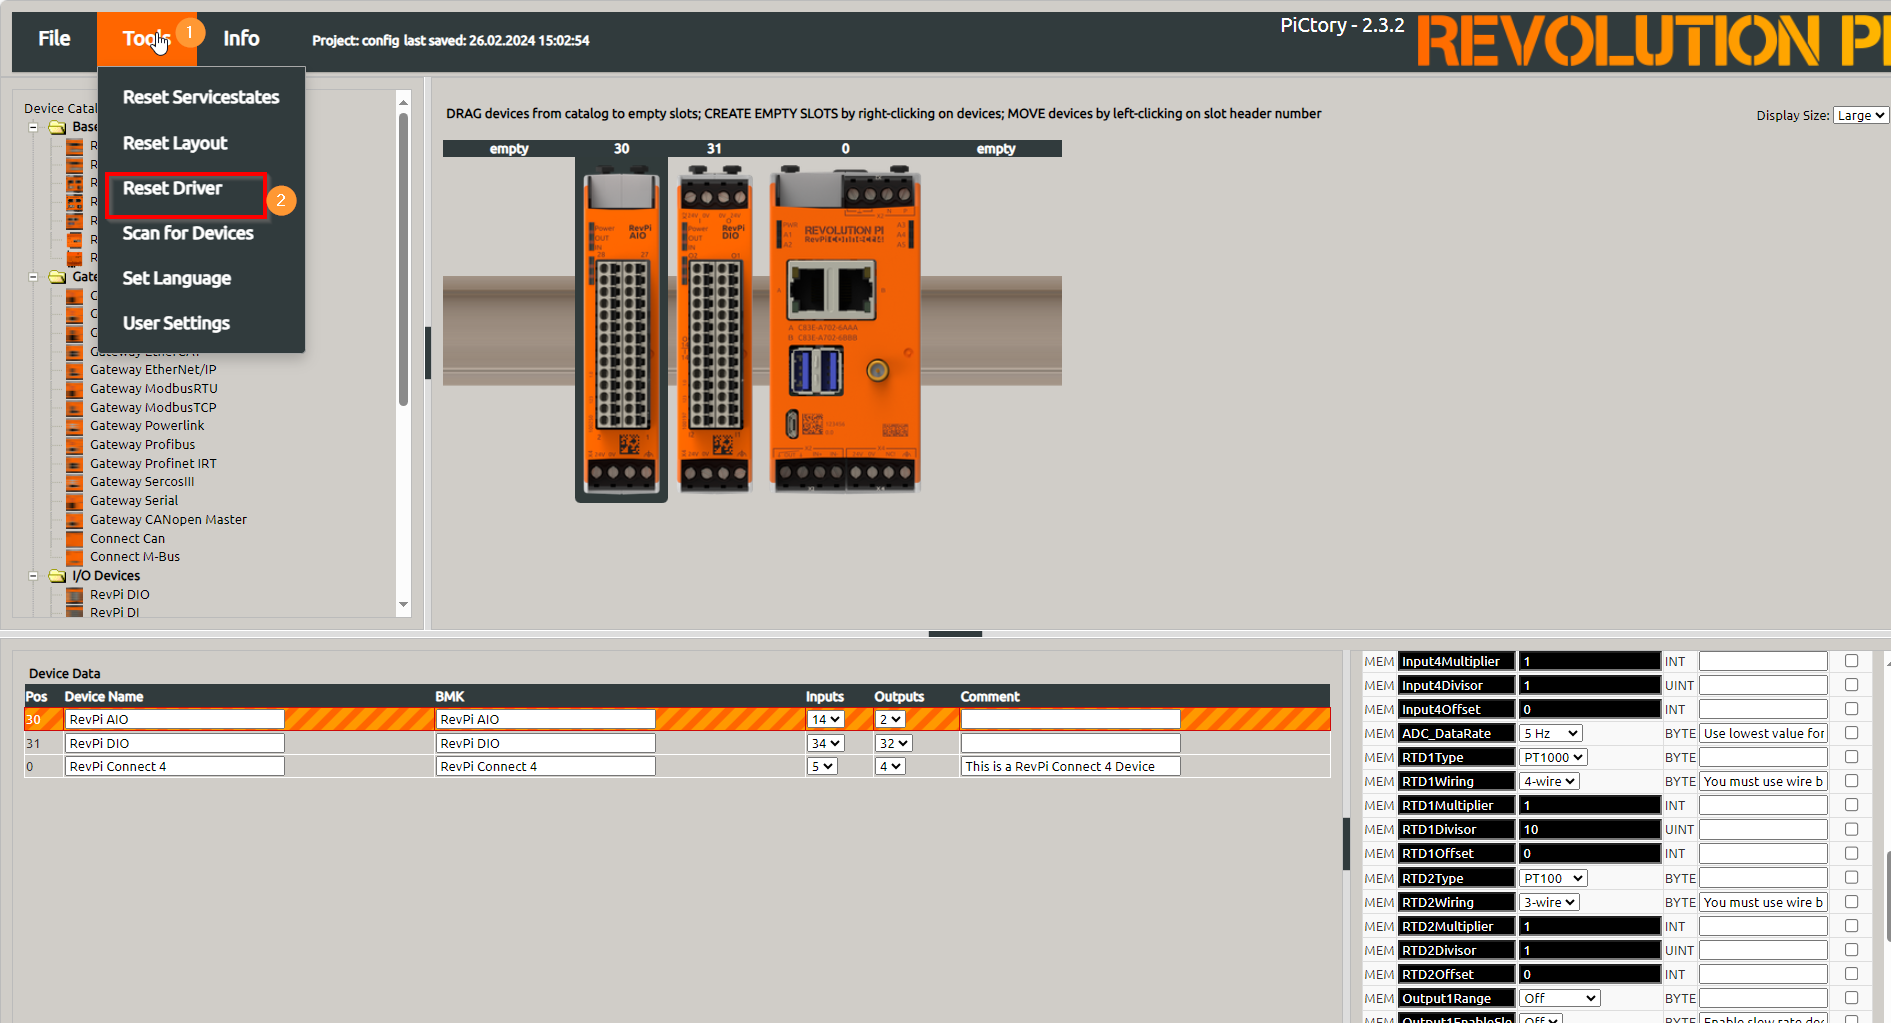
Step 2: Configure your RevPi AIO #
Your RevPi AIO has 2 RTD channels. You can use these to determine the temperature of connected PT-100 and PT-1000 sensors. More information can be found here: RevPi AIO RTD channels
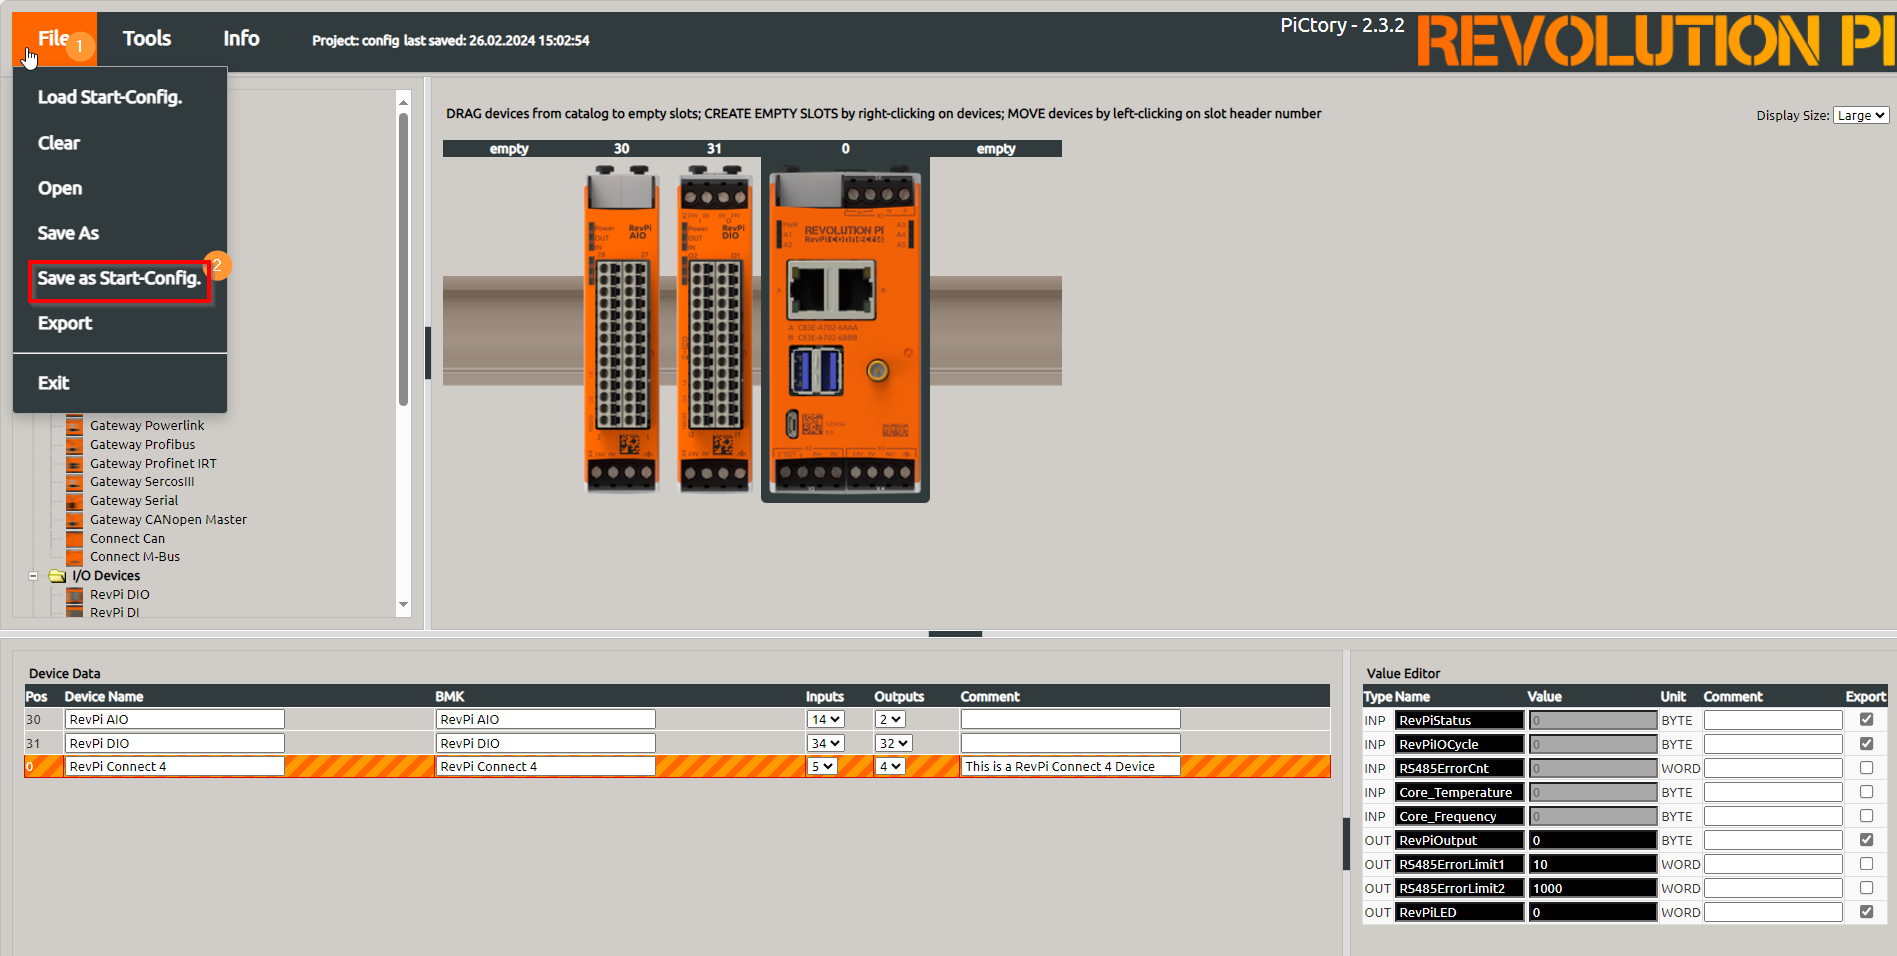
▷ Click "File - Save as start-config" to save the file.
▷ Click "Tools - Reset Driver" to activate your configuration.
Step 3 Installing InfluxDB2 #
Open a terminal on your computer and connect to your freshly booted RevPi via SSH using the hostname or IP address of your RevPi.
ssh pi@your-revpi-ip-address

or

ssh pi@your-revpi-name
Once you have entered the SSH password, you should be connected to your RevPi. To apply the latest changes to the packages on your RevPi before proceeding with the installation of InfluxDB2, enter the following commands:
sudo apt updateOnce this is complete, add the key for InfluxDB and install it:
echo 'deb [signed-by=/etc/apt/trusted.gpg.d/influxdata-archive_compat.gpg] https://repos.influxdata.com/debian stable main' | sudo tee /etc/apt/sources.list.d/influxdata.list

cat influxdata-archive_compat.key | gpg --dearmor | sudo tee /etc/apt/trusted.gpg.d/influxdata-archive_compat.gpg > /dev/null
sudo apt update && sudo apt install -y influxdb2
Run InfluxDB as a service (i.e., it will run at boot and restart if it crashes) by entering the following lines:
sudo systemctl unmask influxdb.service

sudo systemctl start influxdb

sudo systemctl enable influxdb.service
InfluxDB2 should be configured by default. During the installation of InfluxDB2, the influxdb2-cli package is used to configure and manage InfluxDB2. If the package is not installed, you can install it using the following command:
sudo apt install influxdb2-cliSure, let’s continue with the translation:
The influxdb2-cli package provides commands to configure the InfluxDB2 instance, manage databases and buckets, set up users and permissions, and much more. With this tool, you can conveniently perform the entire configuration of InfluxDB2 via the command line, making it easier to manage your time-series database.
Enter the following in the terminal of your RevPi via SSH to configure InfluxDB2:
influx setupYou will be prompted to enter the following information:
-
Username
-
Password
-
Organization name
-
Bucket name
Alternatively, you can configure InfluxDB2 during the first login via the web browser. The login is done by entering the IP address of your RevPi along with port 8086 in your web browser. For example: 192.168.1.214:8086
|
Note
|
A token will be displayed to you after the first login in InfluxDB. Copy it and save it in a secure place on your computer to ensure you do not lose it. |
Step 4: Installing Grafana #
Enter the following in the terminal of your RevPi via SSH to download the Grafana GPG key, install it, and run it as a service:
wget -O- https://packages.grafana.com/gpg.key | gpg --dearmor | sudo tee /usr/share/keyrings/grafana-archive-keyring.gpg >/dev/nullecho "deb [signed-by=/usr/share/keyrings/grafana-archive-keyring.gpg] https://packages.grafana.com/oss/deb stable main" | sudo tee /etc/apt/sources.list.d/grafana.list
sudo apt update && sudo apt install -y grafana
sudo systemctl unmask grafana-server.service
sudo systemctl start grafana-server
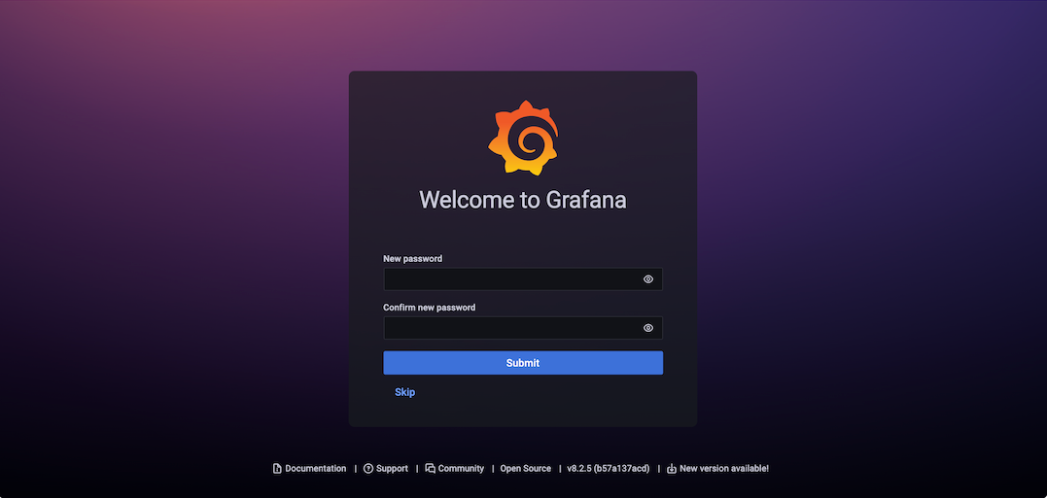
sudo systemctl enable grafana-server.serviceYour Grafana server should now be running and accessible via a web browser. Enter the IP address (http://your-revpi-ip-address:3000) or the hostname (http://RevPi99920:3000) of your RevPi in the address bar of your web browser. Log in with the username "admin" and the password "admin" and change the password to something new when prompted.
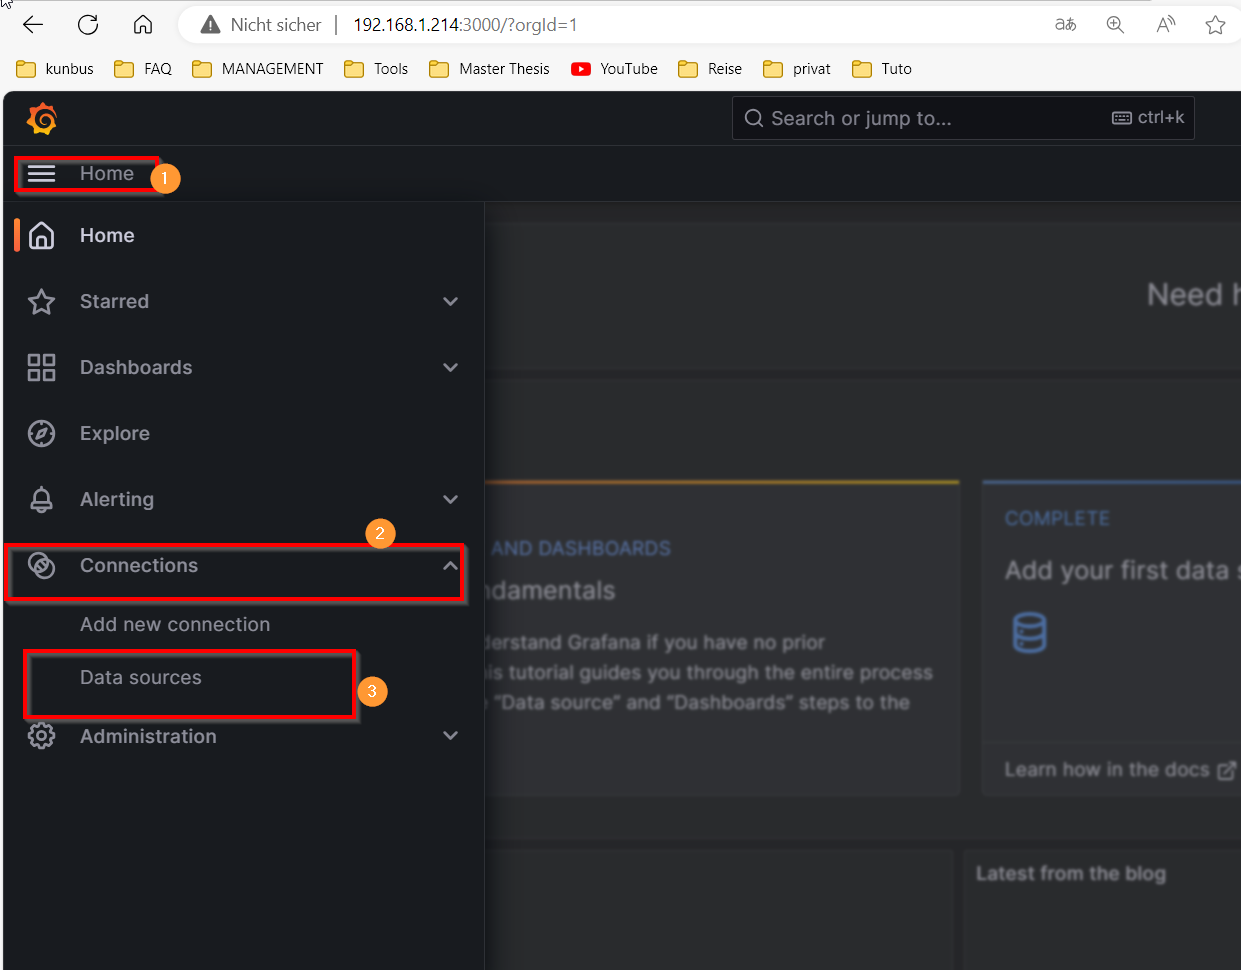
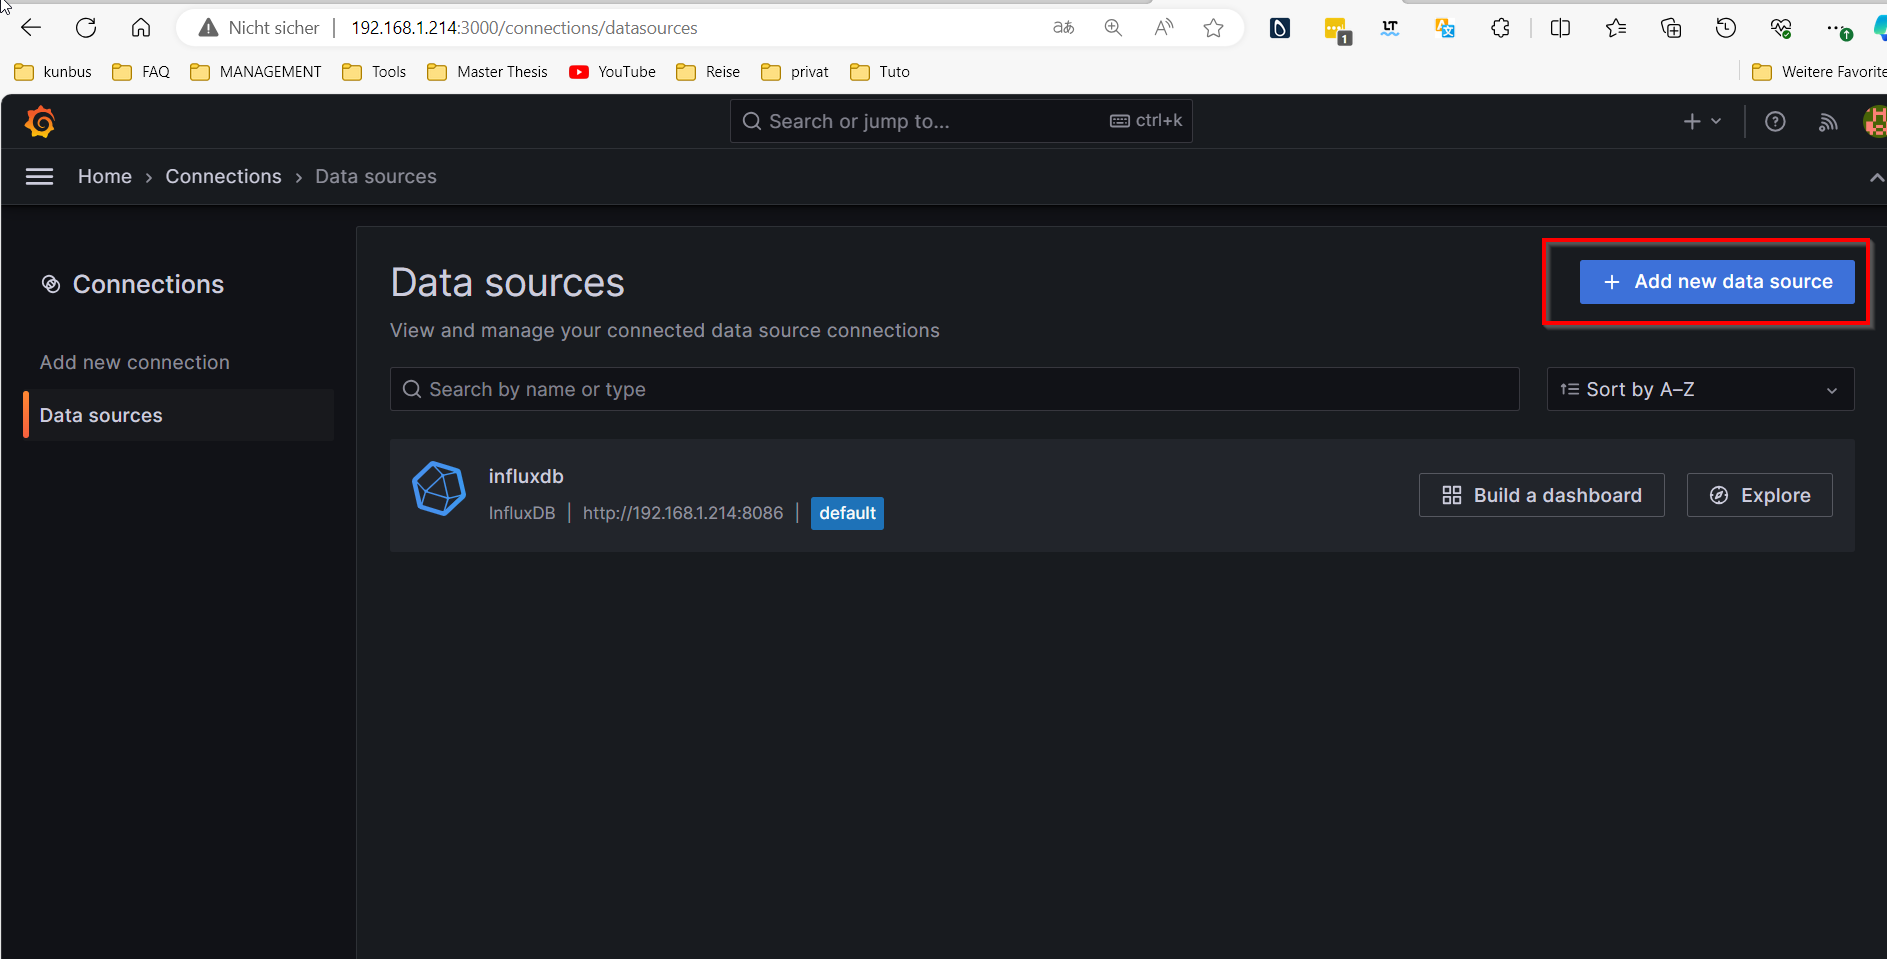
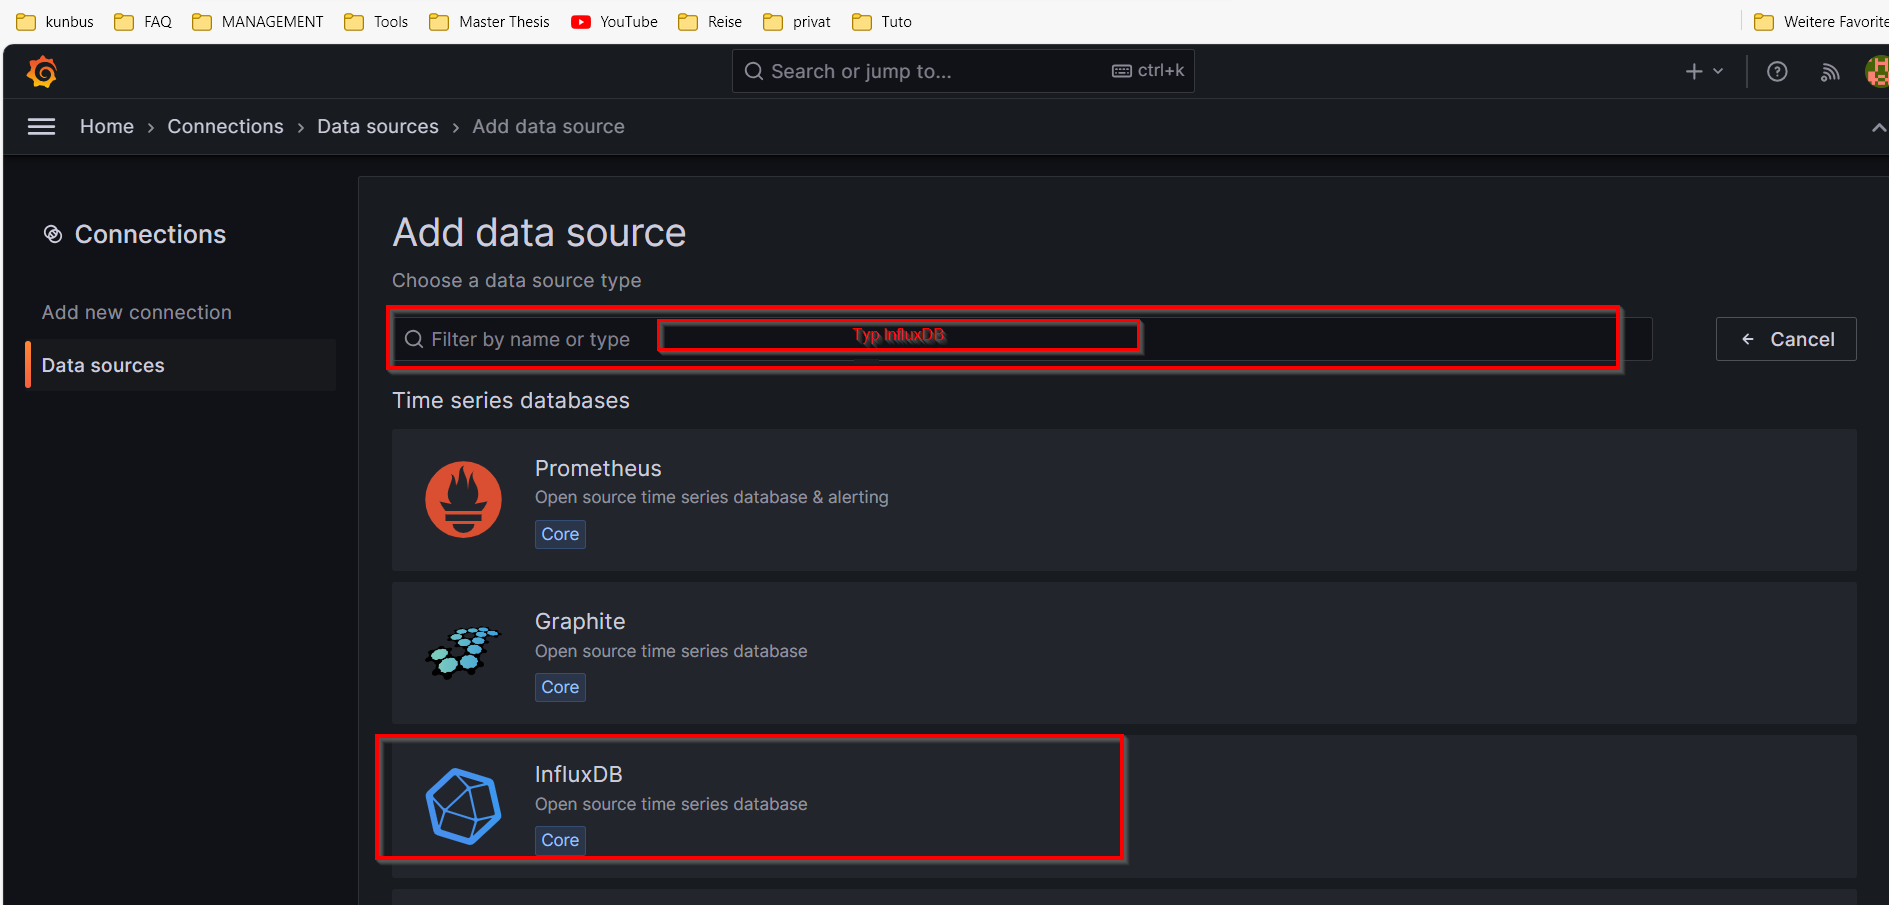
Once logged in, click on the "Home" menu in the left sidebar and then select "Data Sources" from the "Connections" dropdown menu. On the "Data Sources" page, click "Add new data source" and search for "InfluxDB," then select it. This will take you to a page where you can configure your InfluxDB data source.
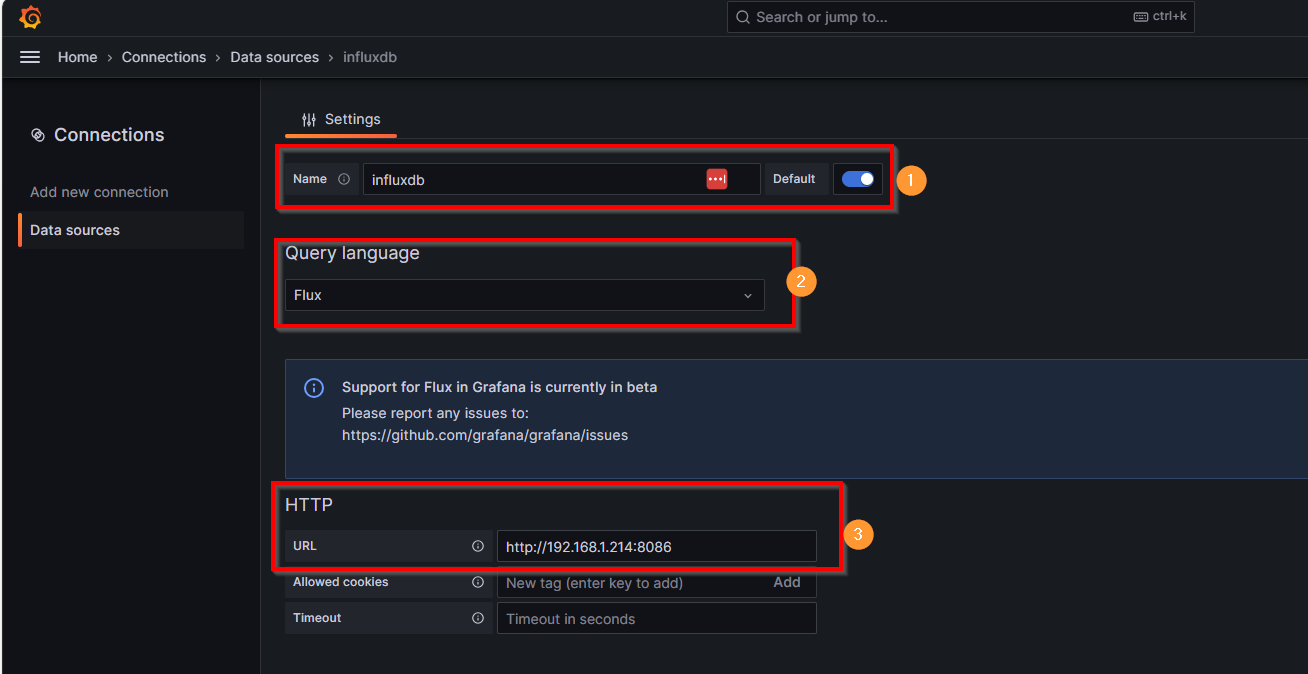
In the "Query language" field, select the "Flux" option. In the "HTTP" section, enter the URL in the corresponding field, e.g., http://192.168.1.214:8086.
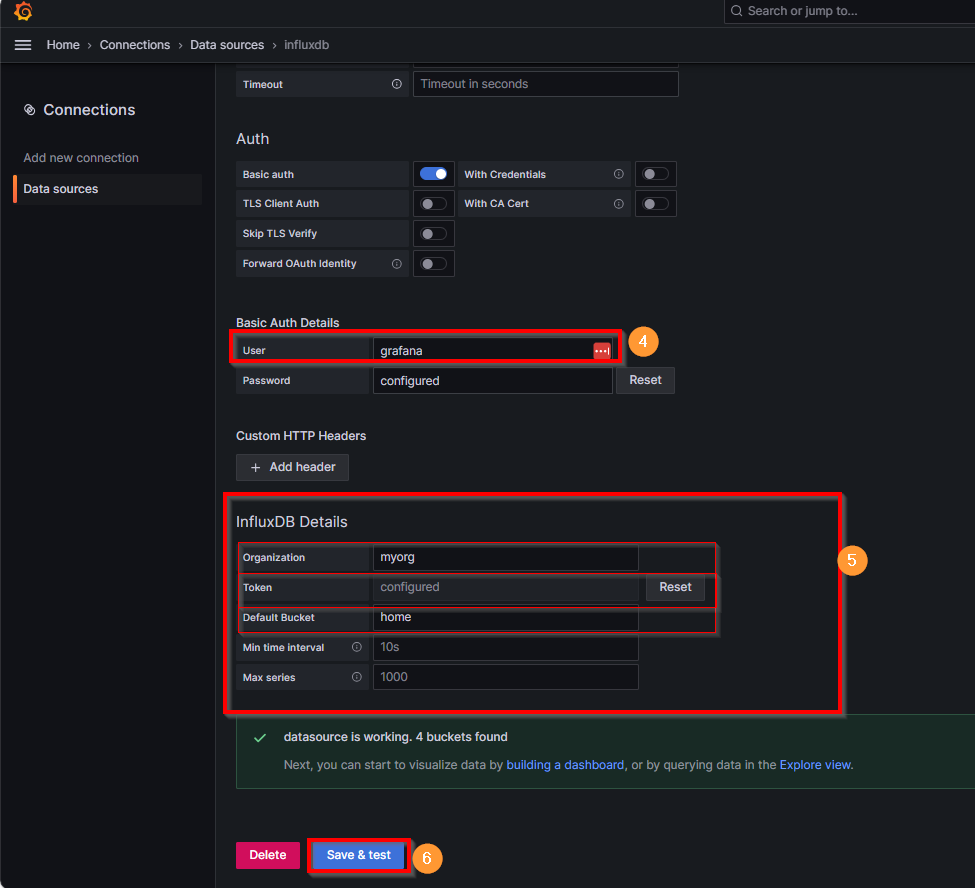
In the "Basic Auth Details" section, enter the authentication information for InfluxDB, including the username and password you set up earlier when configuring InfluxDB.
Further down the page, in the "InfluxDB Details" section, enter additional authentication information for InfluxDB, including the organization, token, and default bucket you set up earlier.
Finally, click "Save and Test" and ensure that "Data source is working. 3 buckets found" is displayed.
Step 5: Installing the InfluxDB Python Libraries #
To read the data from the PT1000 temperature sensor and the inductive proximity sensor, we need to use the Revpimodio Python library from Revolution Pi. Additionally, we need the InfluxDB Python library to send the values read by the sensors directly to our InfluxDB buckets.
Open a terminal on your computer, connect to your RevPi via SSH, and execute the following commands step by step:
sudo apt updatesudo apt upgrade -ysudo pip3 install influxdbpip install influxdb-clientsudo rebootWith this, you are well-equipped regarding the Python libraries. Next, let’s look at the program that reads the sensor data and sends it to the InfluxDB bucket.
Step 6: Logging Data in the InfluxDB2 Database #
Below, we take a look at the program that reads the sensor values and writes them to the InfluxDB database.
import time
import datetime
from influxdb_client import InfluxDBClient, Point
from influxdb_client.client.write_api import SYNCHRONOUS
import revpimodio2

# Set up InfluxDB
url = 'http://192.168.1.214:8086'  # Change this accordingly
token = 'h_3knkCVjx5W3LU18H7Z0Zx6Q-rAUtBCXgmJ77ppnCL0RGrR-zJIkwAs0xU6zKQ2LKnWbb6_qAd-9Zq_-kVFlQ==' # Change this accordingly
org = 'myorg'  # Change this accordingly
bucket = 'home'   # Change this accordingly

# InfluxDB client for writing
client = InfluxDBClient(url=url, token=token)
measurement = "indoor"
location = "sleep_room"

# Logs the data to your InfluxDB
def send_to_influxdb(measurement, location, timestamp, temperature, sensor):
    write_api = client.write_api(write_options=SYNCHRONOUS)
    point = Point(measurement).tag('location', location).field('temperature', temperature).field('sensor', sensor).time(timestamp)
    write_api.write(bucket=bucket, org=org, record=point)

# RevPiModIO initialization
rpi = revpimodio2.RevPiModIO(autorefresh=True)

# Endless loop for data transmission
while True:
    temperature = rpi.io.RTDValue_1.value
    sensor = rpi.io.I_2.value
    timestamp = datetime.datetime.utcnow()
    # Send data to InfluxDB and print it in the terminal
    send_to_influxdb(measurement, location, timestamp, temperature, sensor)
    print(measurement, location, timestamp, temperature, sensor)
    time.sleep(0.25)
Enter the following commands in the terminal to save and start the program:
sudo nano log_to_influxdb.pyMake the necessary changes in the program code according to your setup. Copy the above program code and paste it into the Nano editor. Then press Ctrl + X to exit the editor, confirm with Y, and press Enter.
To run the program, enter the following command:
python3 log_to_influxdb.pyStep 7: Setting Up a Dashboard on InfluxDB2 and Grafana to Display the Data #
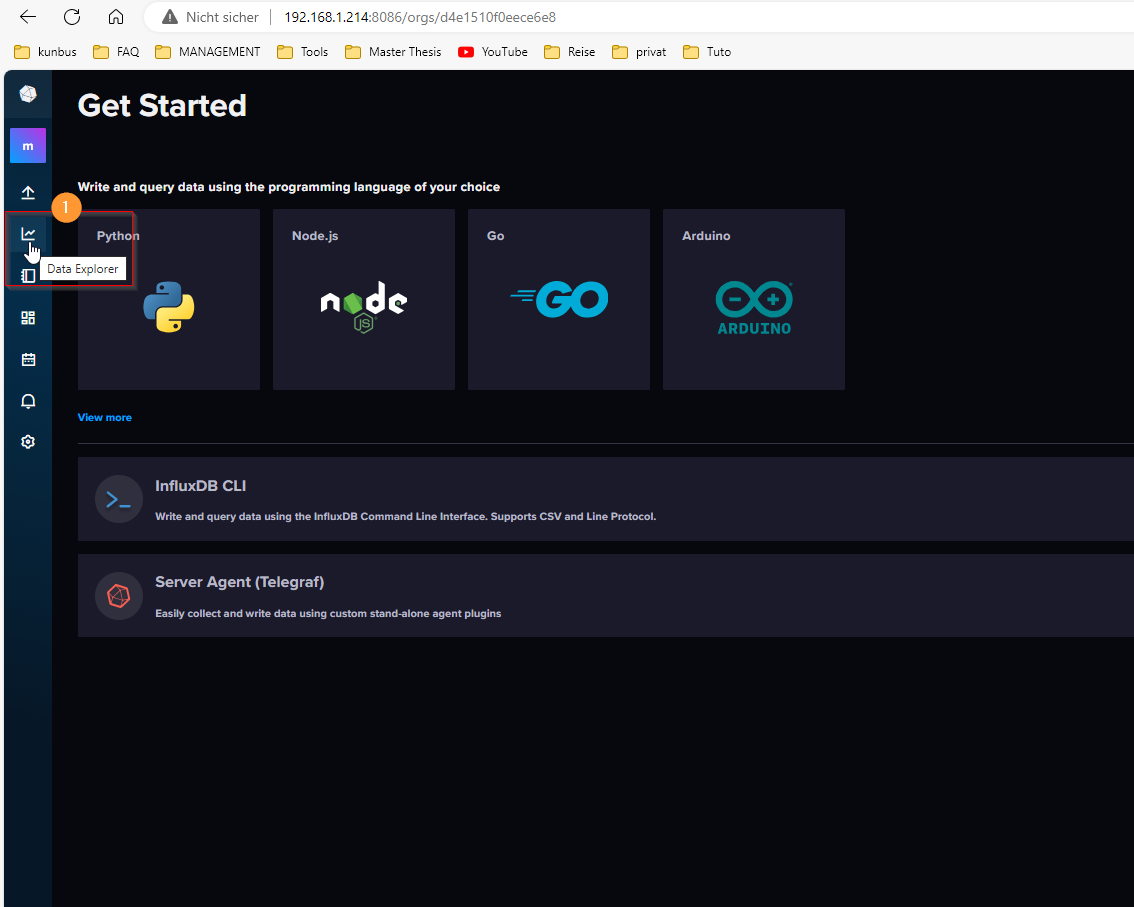
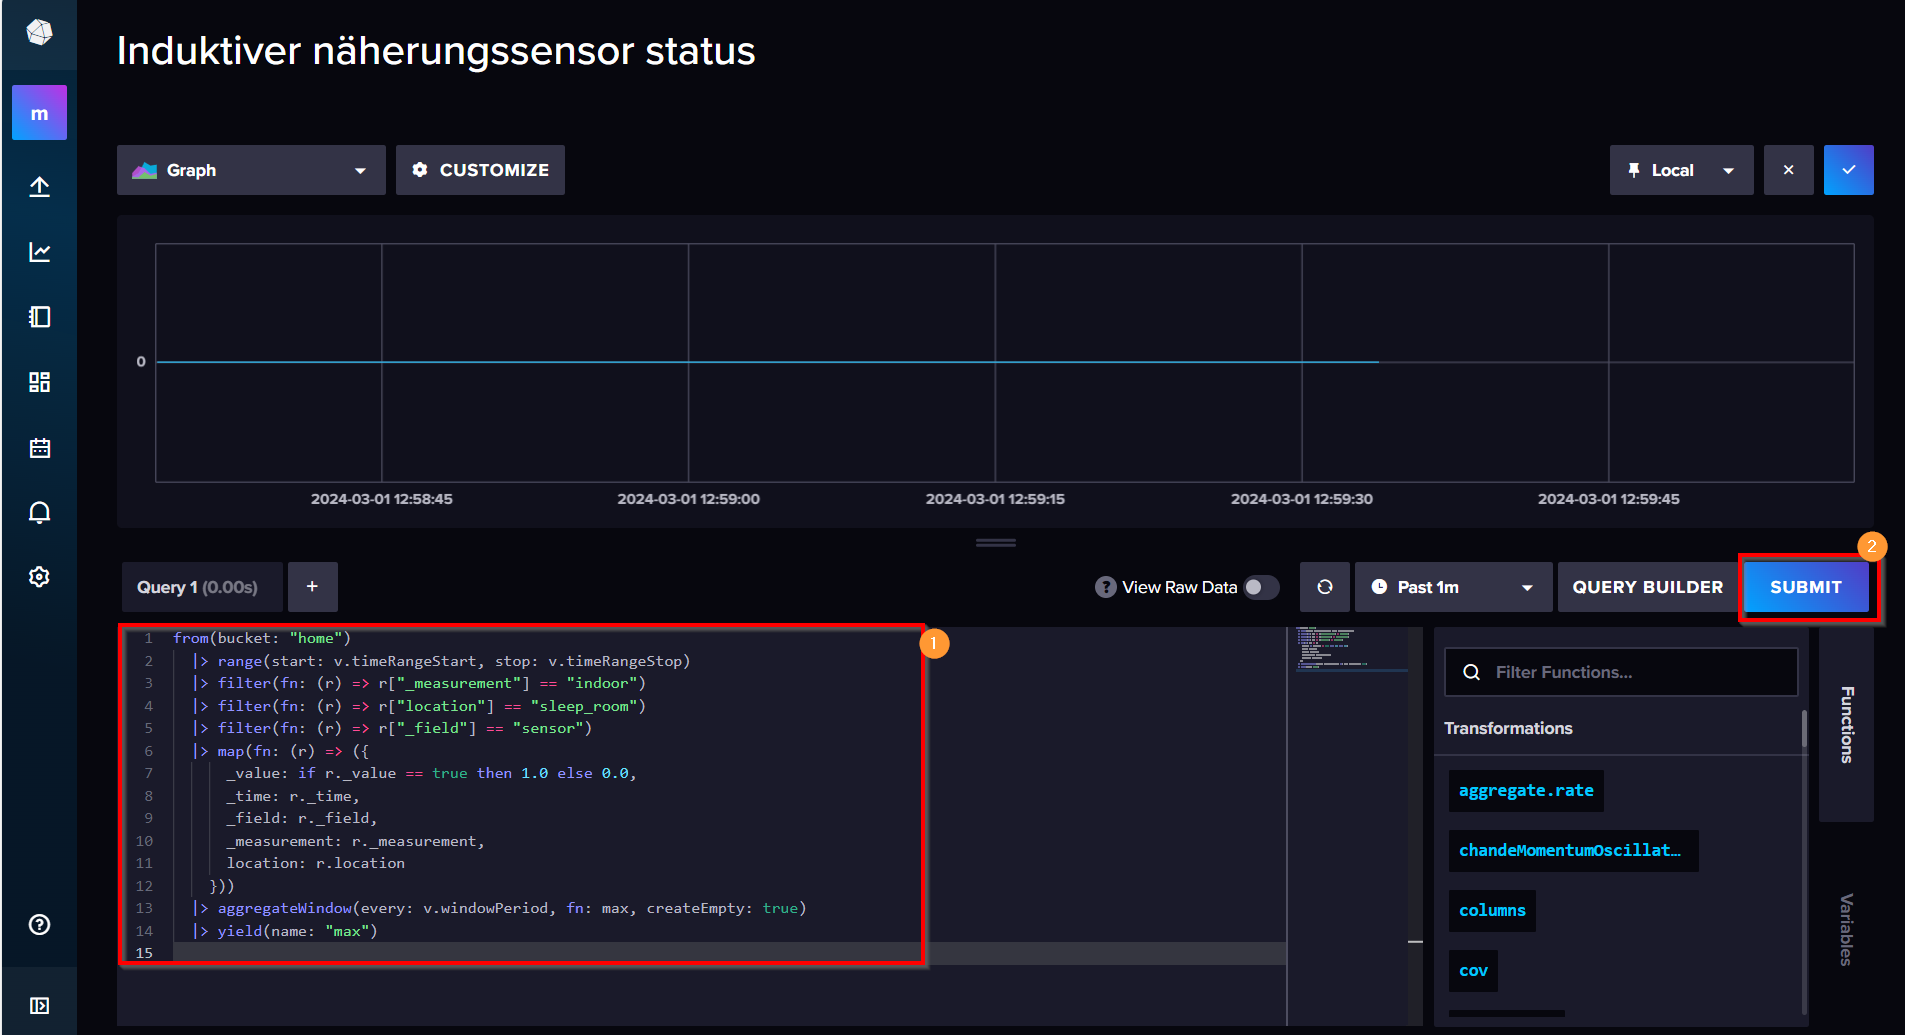
While the program is running, open InfluxDB. Click on "Data Explorer" in the left menu and set up a dashboard as follows:
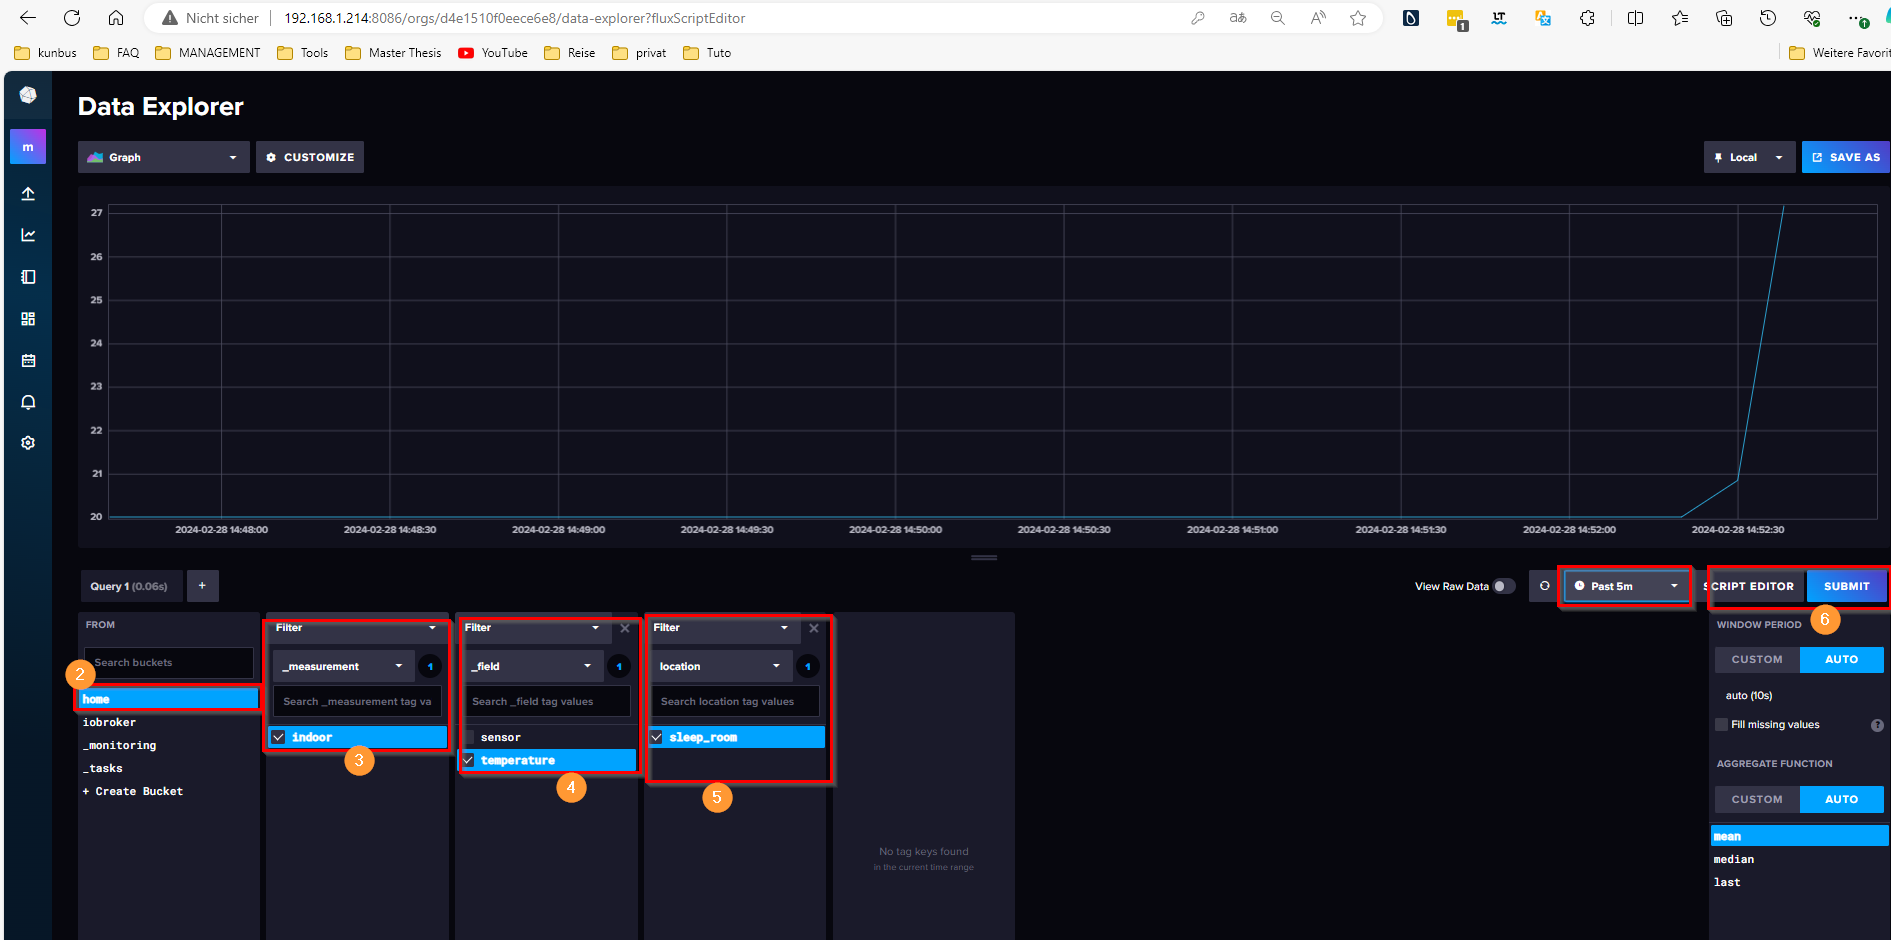 The images above show how to create a dashboard to display the temperature values of the PT-1000. To have this dashboard in Grafana as well, you need to click on "SCRIPT EDITOR" and copy the Flux script, then use it in Grafana.
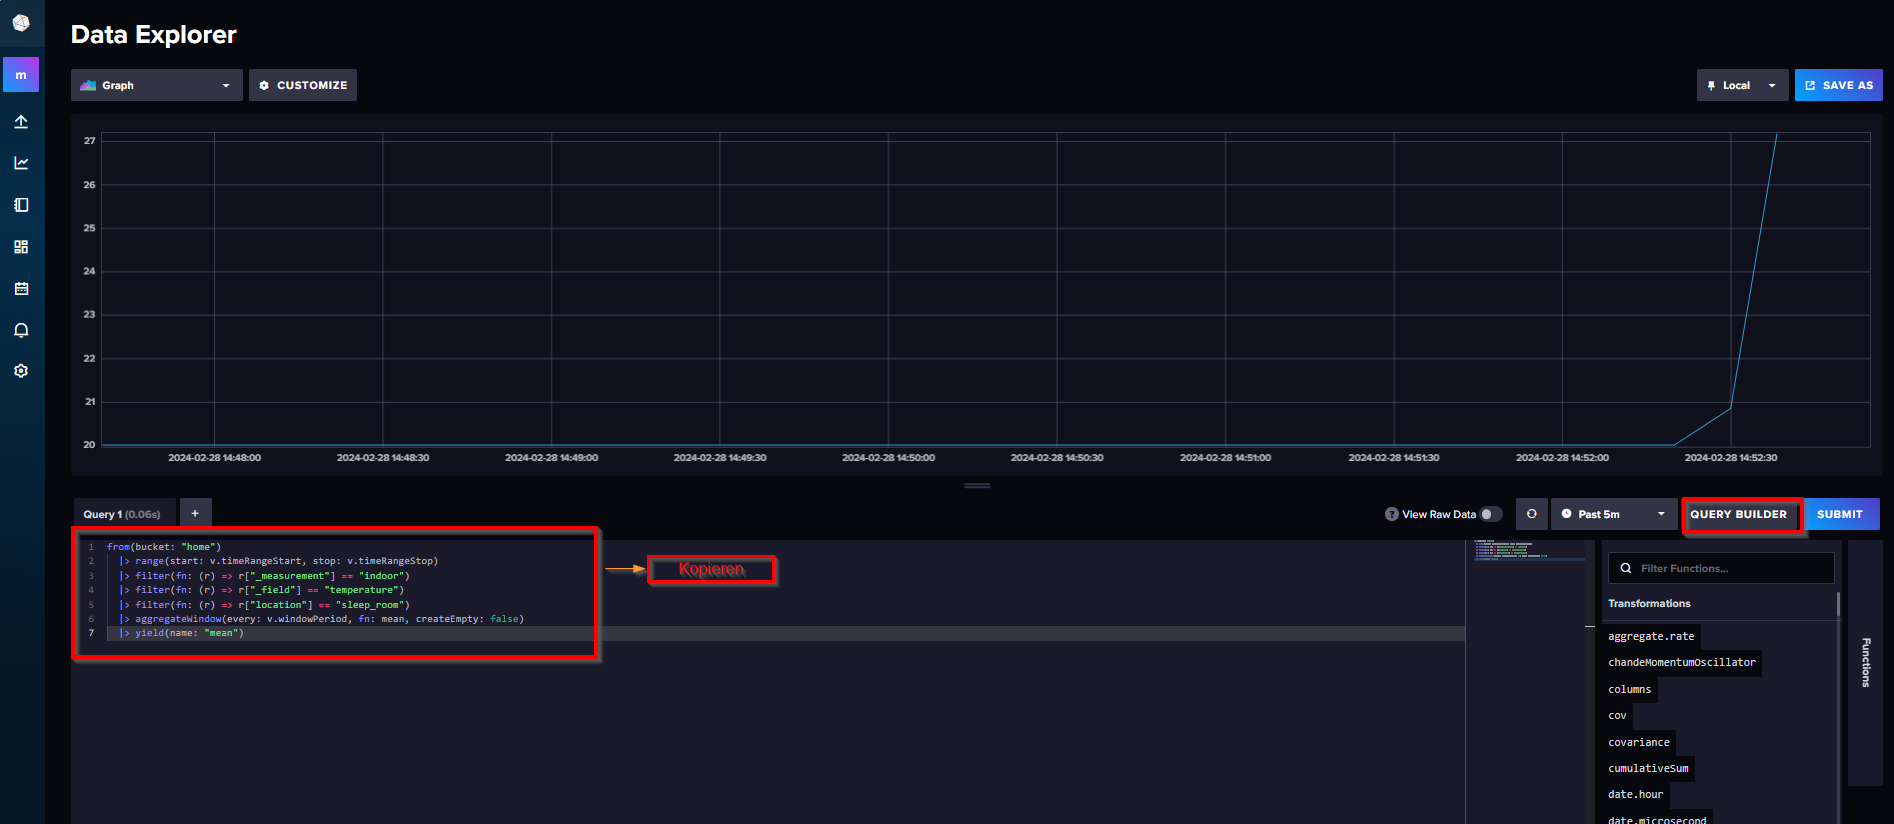
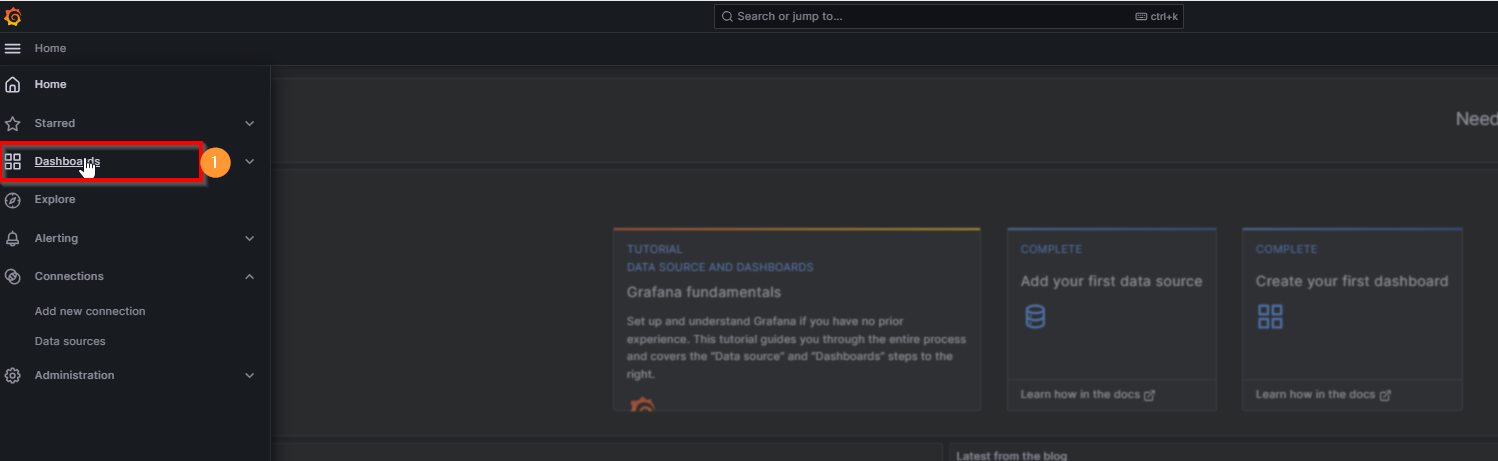
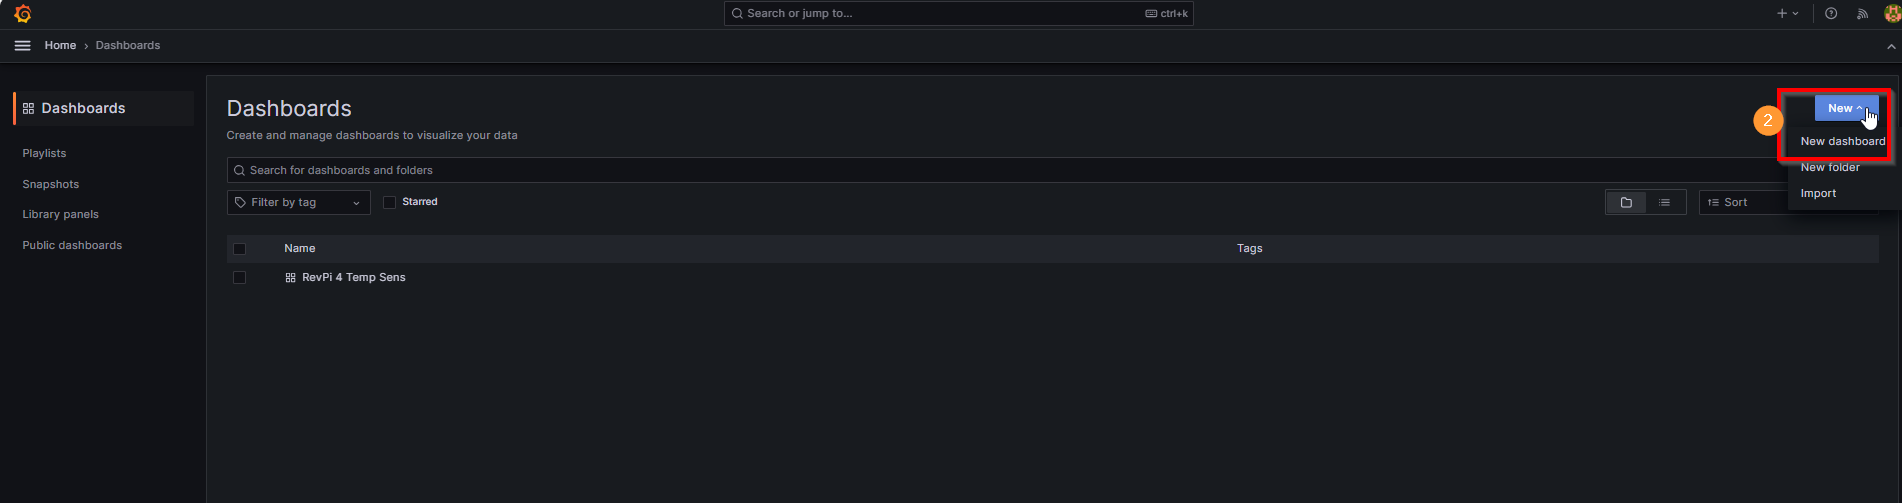
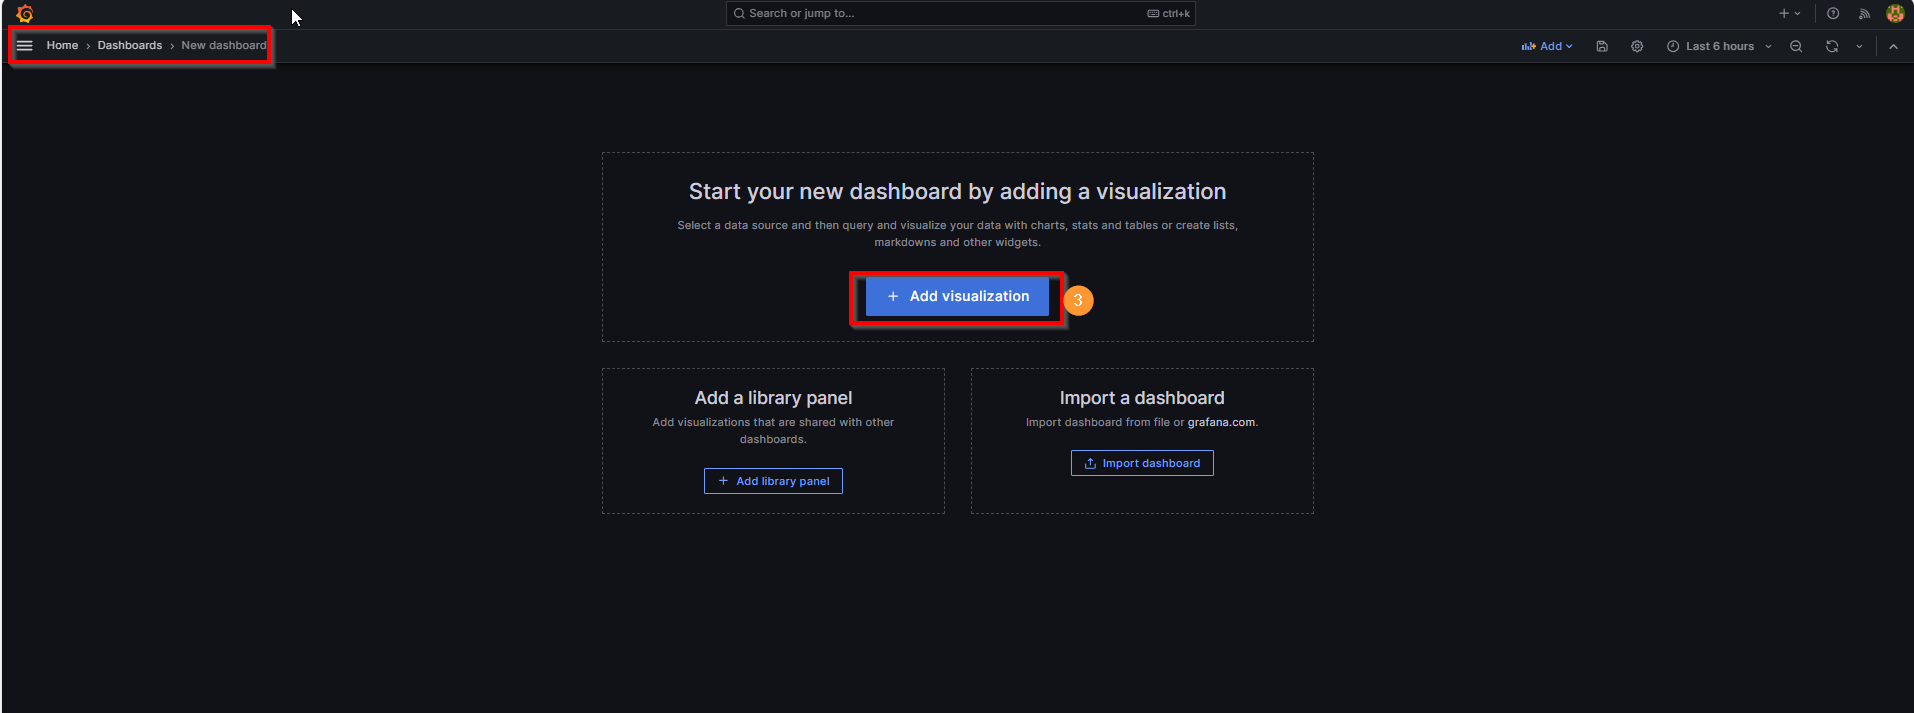
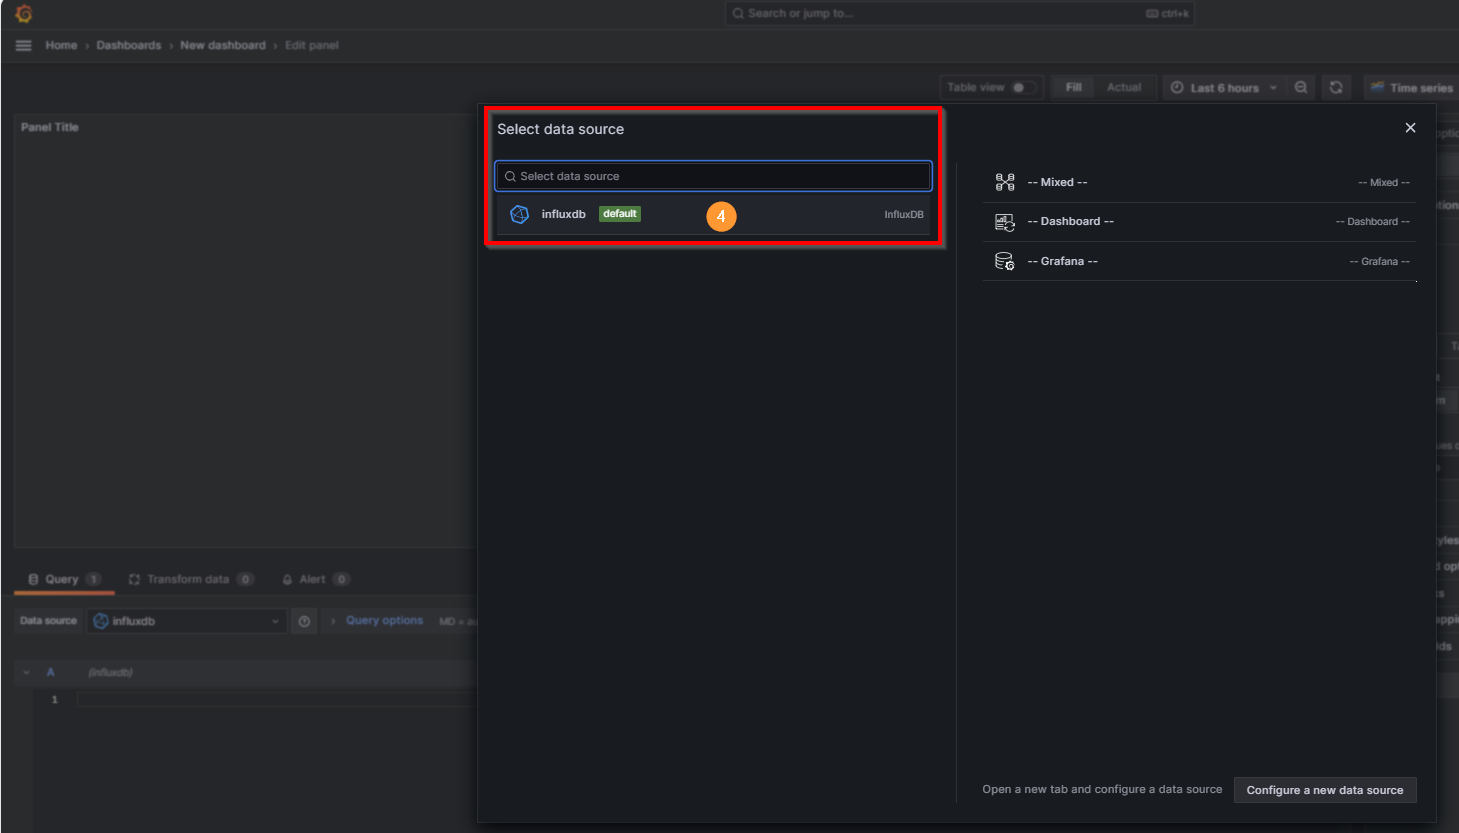
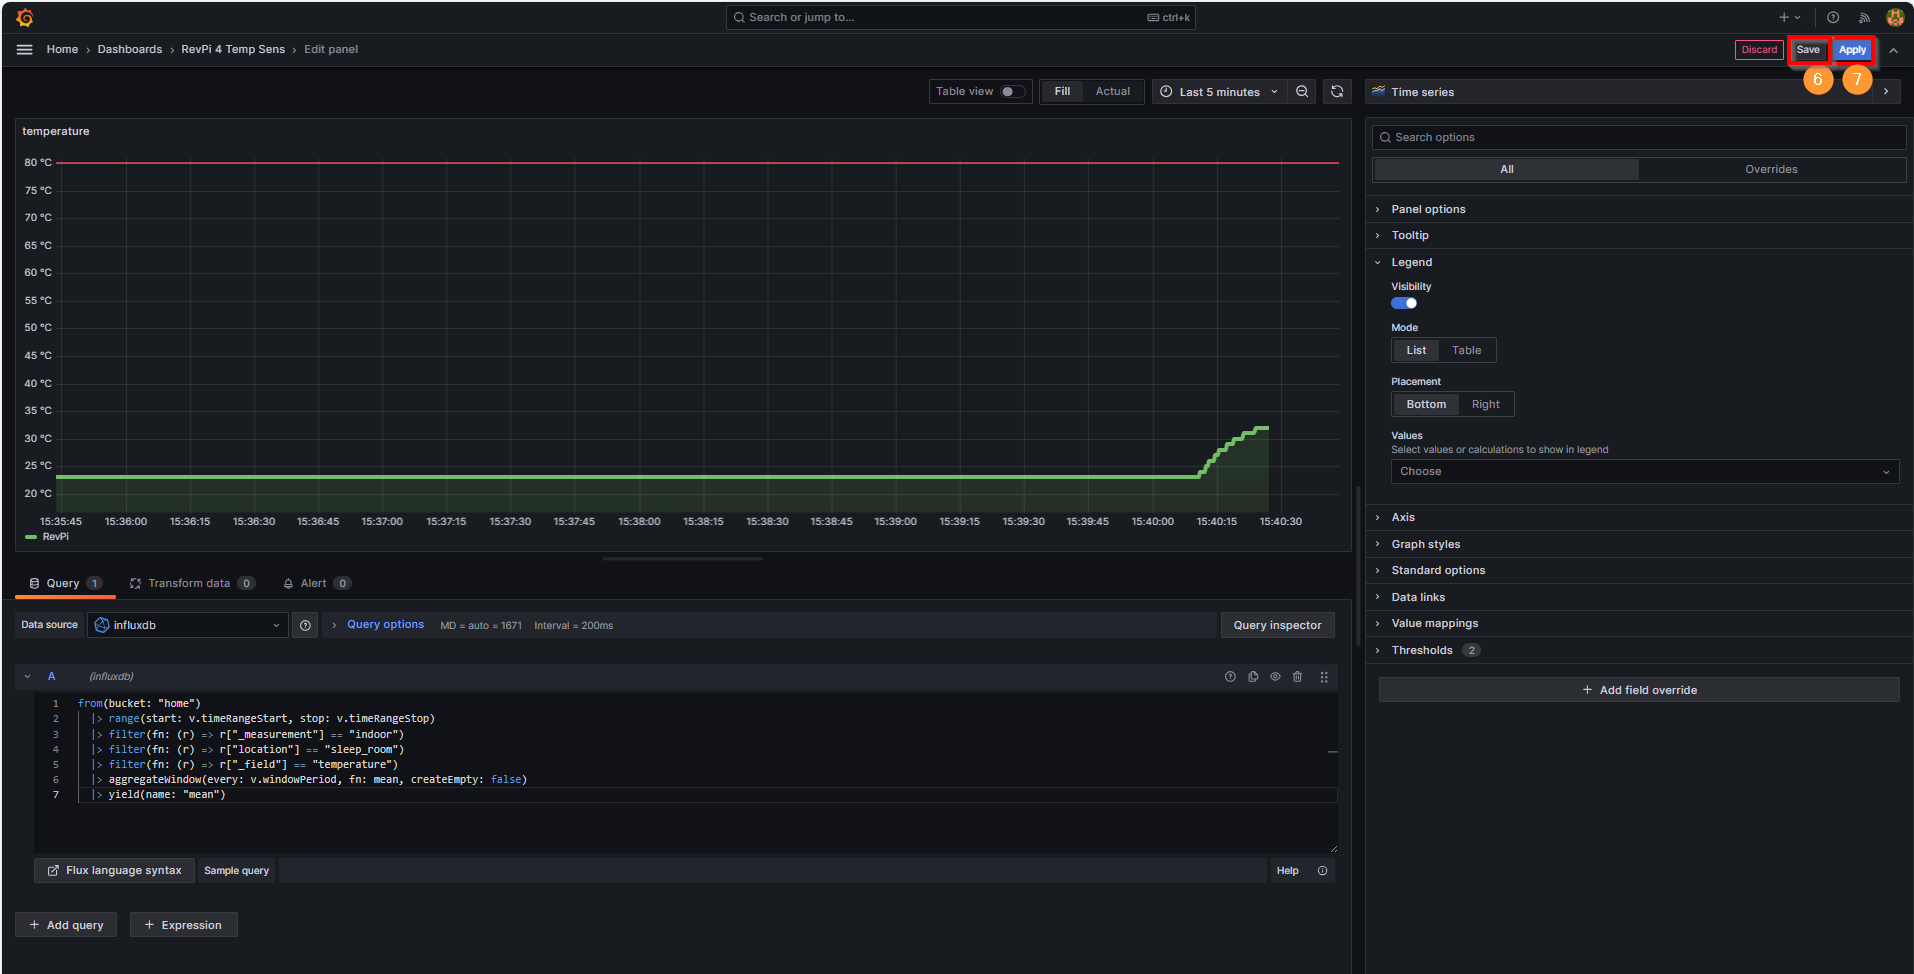
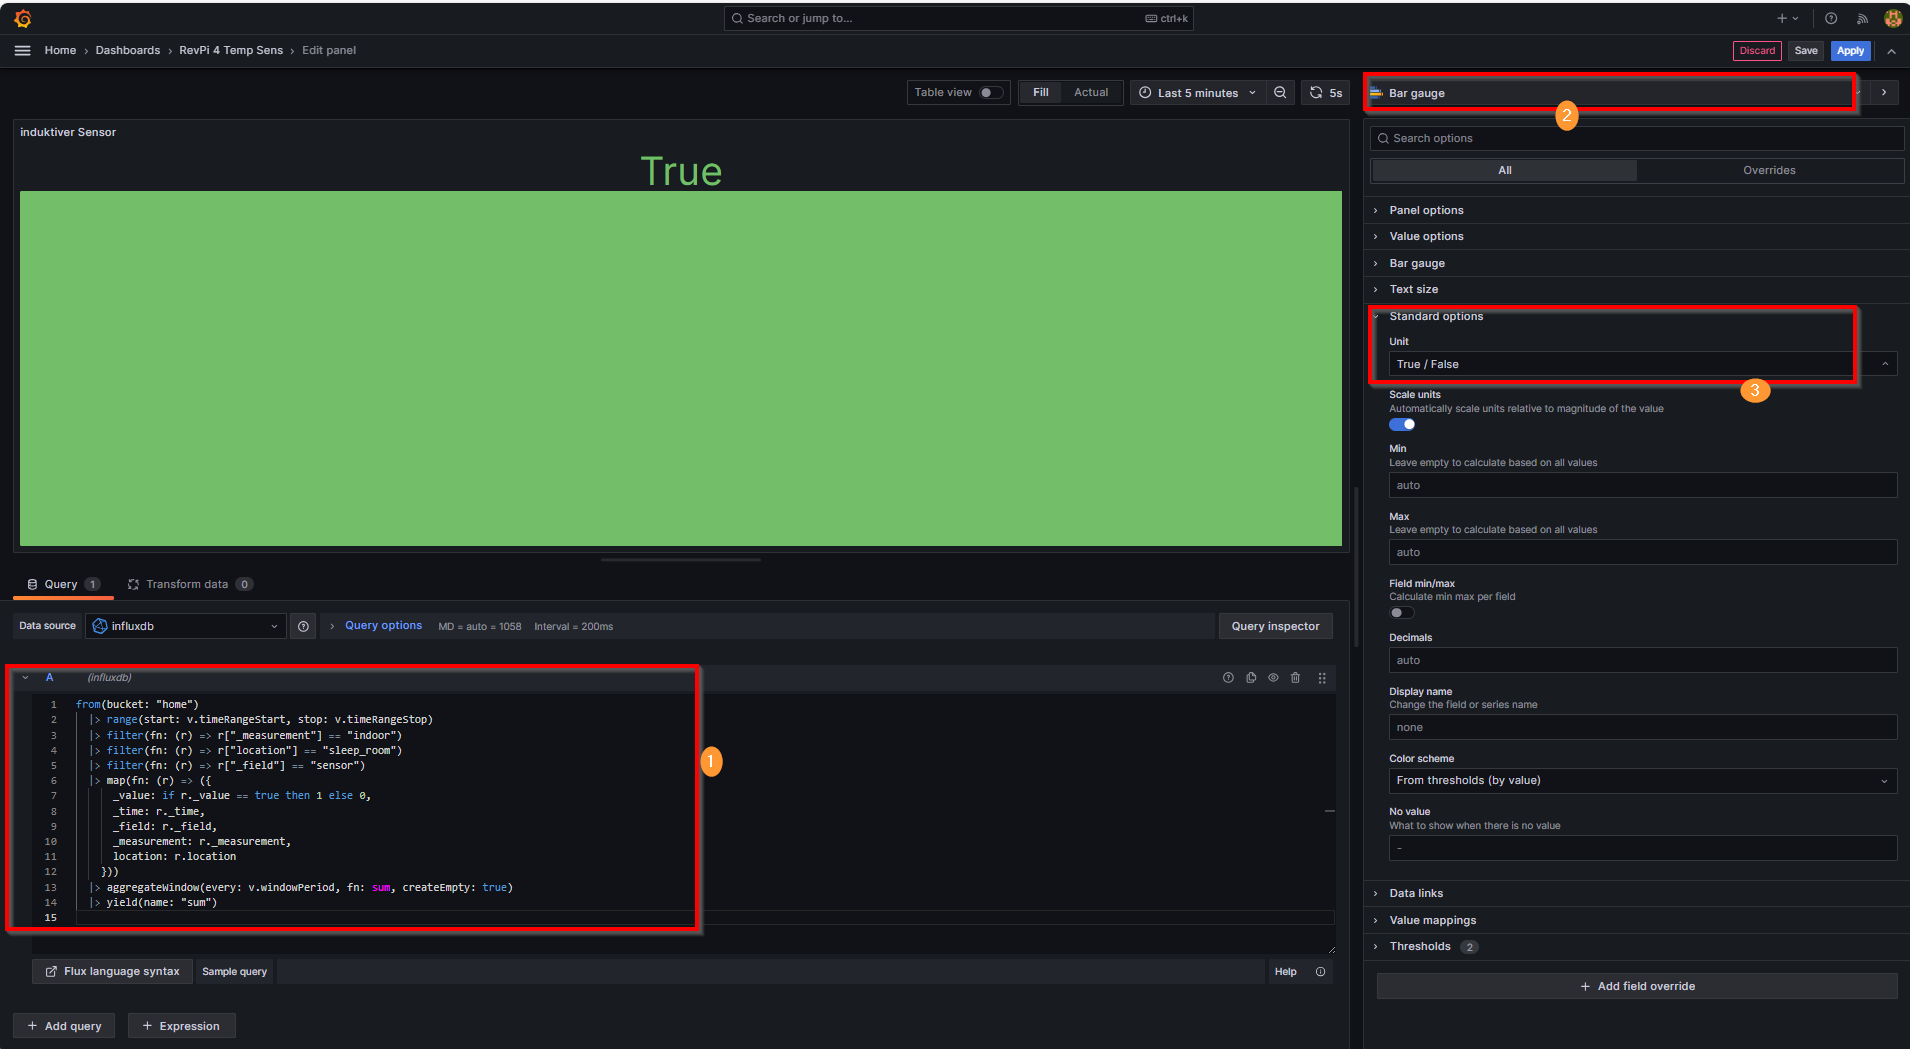
In the Grafana menu, click on "Dashboards," then "New," and subsequently "New Dashboard." On the "New Dashboard" page, click on "Add visualization." A new window with "InfluxDB" as the default data source will appear. Click on InfluxDB and then paste the copied Flux code into the query terminal. The following images guide you through the process of creating a dashboard in Grafana.
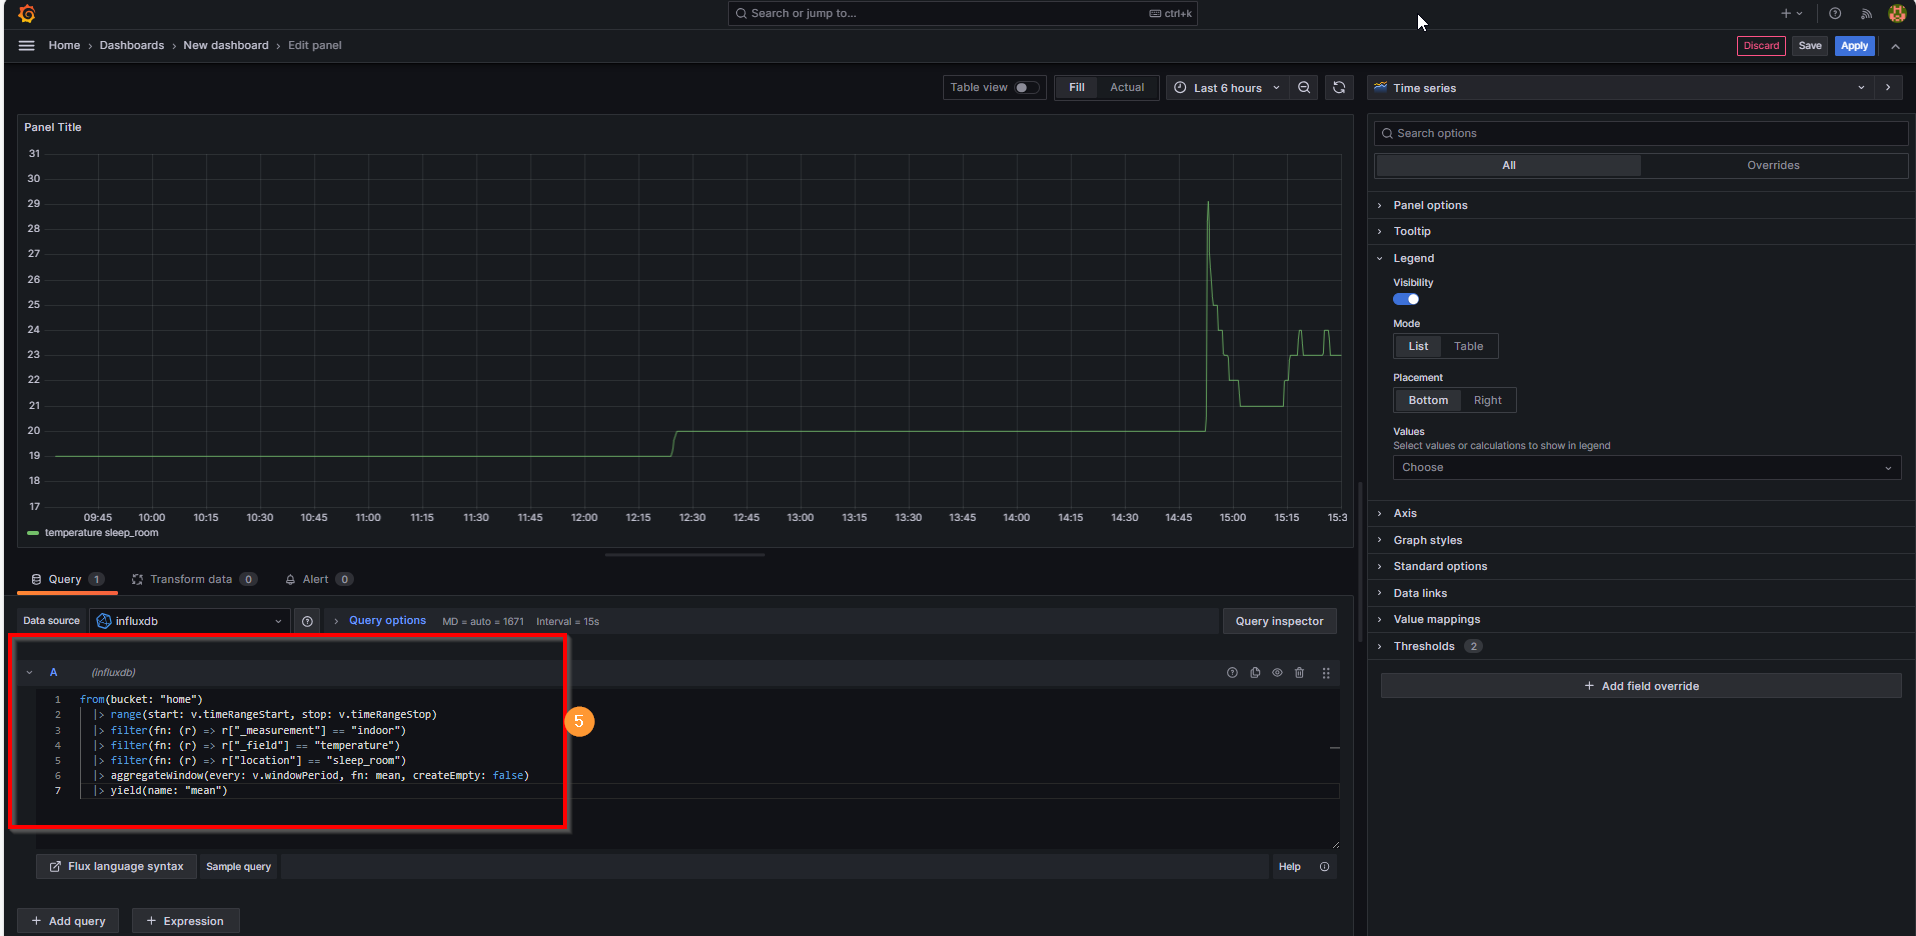
On the right side, you will find all the tools to beautify and label the dashboard. After each change, you can name the dashboard and save it by clicking on "Save" and then on "Apply."
You have now successfully visualized the temperature of the PT-1000 sensor via the RevPi AIO. Visualizing the status of the inductive proximity sensor via the RevPi DIO module in InfluxDB and Grafana is a bit more complex. In Flux, there is no specific function for filtering boolean values. Therefore, it is advisable to explore alternative methods for aggregating and visualizing boolean values.
Hopefully, you now know how to send data to your InfluxDB database and display this data on a Grafana dashboard. If you’re like me, this will only be the beginning, and you’ll keep adding more sensors to collect more data!