In the “Basic knowledge current measurement” tutorial we have explained in detail why sensors with current output (4 to 20 mA) have some major advantages compared to sensors with voltage output. This tutorial is about voltage measurement, so once again an example where we can explain the main problem of voltage measurement:
In an ideal scenario, no currents would flow during a voltage measurement. In reality, however, all voltage measuring devices, i. e. also analog inputs of controllers, have a finite input resistance. In our example, this input resistance is R = 10 kΩ (which is not a very good value for a measuring device… our AIO voltage inputs have 900 kΩ). When you apply a voltage U to be measured to this input, then a current I = U / R flows. This current is therefore smaller the higher the input resistance is. This current is a problem because it distorts the measurement result. In addition to the input resistance, there are also the resistance of the lines and the internal resistance of the voltage source (the sensor). Ideally, these resistances should be 0 Ω In reality, however, they are in fact resistances with relatively small values. In our example we assumed 15 Ω each for the cables from the sensor to the controller and 10 Ω internal resistance for the sensor. This is a total of 40 Ω, which are all arranged in series connection with the input resistance.
The small measuring current therefore flows through all these “parasitic” resistors and generates a voltage drop of U = R*I. This voltage drop causes the sensor voltage at the controller to be measured too low. The smaller the line and internal resistances are and the lower the measuring current, the smaller the voltage drop and thus also the measuring error. In our example, the sensor actually outputs a voltage of 8.52 V. However, a voltage of 8.486 V is measured at the analog input of the controller. The measuring current of only 850 µA thus generates a voltage drop due to the parasitic resistors of 34 mV. This is already 0.4% measurement error.
The AIO voltage inputs are differential inputs
Since our voltage inputs have an input resistance of approx. 900 kΩ, the accuracy problem of voltage measurement caused by line resistances or high internal resistance of sensors is negligible when using our AIO. However, voltage inputs have a much higher sensitivity against interference than current inputs. The higher the input resistance of a measuring amplifier and the sensor’s internal resistance, the more easily electromagnetic radiation can be coupled onto the lines. Therefore, high-precision inputs are designed as differential inputs, like in our AIO. At such a differential input, a potential compared to the device ground (GND or PE or FE) is not simply measured (as with a single-ended input). Instead, two potentials are compared; their difference is the measurement result. The advantage of such measurement method is that electromagnetic radiation usually changes both lines of the sensor by the same amount in the potential. The difference in the potentials on the two lines thus remains the same. In order to make the most of this effect, you should use twisted pair wires. In the following two pictures we show you the difference between a single-ended and a differential analog input when a disturbance pulse affects the sensor cable.
Galvanic isolation of the inputs and outputs:
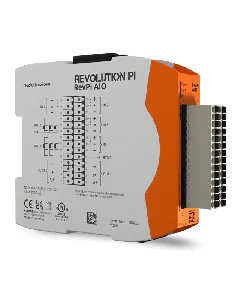
The 4 inputs (both for current and voltage) have together with the RTD inputs internally a common reference potential for their power supplies. That means, that they are not galvanically isolated from each other. Therefore, the potentials at all input pins must not be too far apart. According to the specification, we only allow a maximum difference of 45 V potential difference. However, our AIO has a galvanic isolation between input and output connections, which has a voltage resistance of up to 600 V. Potential differences between input and output pins are therefore usually no problem for the AIO module. Both ranges are also galvanically isolated from the 24 V power supply and thus also from the PiBridge and the RevPi Connect. This means that considerable potential differences are no problem there.
Dynamic signals
Generally speaking, the term DC is also used in measurement technology when voltage signals change very slowly. At frequencies below 10 Hz, the typical AC voltage characteristics are no longer of much importance. Sensors often measure signals that change only slowly (temperature, distance, pressure). Therefore, the output signals of these sensors are often considered to be DC voltage signals. Nevertheless, the signals are changing and we want to know the current values at all times. For this purpose we “scan” the signal, i. e. instead of a continuous signal we get many individual measuring points, which are located in a temporal distance to each other. This time interval of the data points is the “data rate” at which the measuring points are sent to the process image (PA). A new measuring point always overwrites the previous measured value. The time interval of this procedure (the data rate) can be set between 1 Hz and 125 Hz in Pictory. If you have very slowly changing measurement values (for example, the temperature), then 1 Hz is probably fine. However, if you want to acquire the measured values of a flow sensor and react quickly to changes, then perhaps 125 Hz is more suitable (this corresponds to 125 data points per second, i. e. a time interval of 8 ms). Please note, however, that the PiBridge usually has a cycle time of more than 10 ms. This means that although the AIO module provides new data every 8 ms, they do not always end up in the process image because the cycle time is too long.
Unfortunately, it’s getting a little more complicated now:In PiCtory we do not provide this PA data rate, but the “ADC data rate”. This is the data rate at which we operate the ADC device ADS1248 from Texas Instruments. Since we switch the input channel between the four channels between each interrogation of the ADC module, this data rate is about 4 to 5 times higher. This is the only way to reliably determine the individual measuring points for all 4 channels within the PA data rate. The ADC data rate can be set between 5 Hz and 640 Hz. Without the above-mentioned limitation by the PiBridge cycle time, the two data rates are related as follows:
ADC data rate |
PA data rate |
5 | 1 |
10 | 2 |
20 | 4 |
40 | 8 |
80 | 10 |
160 | 25 |
320 | 50 |
640 | 125 |
Maybe you’re wondering why you don’t always use the fastest data rate. This is due to the fact that we get into the AC voltage range at frequencies above 10 Hz which results in different conditions. In fact, AC voltage always generates electromagnetic alternating fields. And these radio waves are then received by cables like antennas and distort your measurement signal. The value is then composed of the actual signal from the sensor plus an interference voltage. Since we are “contaminated” with 50 Hz AC in Europe, these 50 Hz signals are superimposed as interference voltage on practically every sensitive measuring input. To measure accurately, the signal must be sent via a filter that strongly reduces (filters out) all signals above 45 Hz: a so-called low-pass filter.
The ADC module in the AIO module is a delta sigma converter. These converter types always have a digital filter (often multi-stage) integrated. The ADC module in the AIO module is a delta sigma converter. These converter types always have an integrated digital filter (often multi-stage) and its filter frequency (the frequencies at which it suppresses signals in particular) is directly related to its data rate. The ADs1248 suppresses 50 Hz particularly effectively with data rates up to 20 Hz. Above that, 50 Hz interference signals have a full effect on the accuracy of the measurement. The filter curves depending on the data rate can be found in this data sheet (from page 30).
You should therefore set the ADC data rate between 5 and 20 Hz for an accurate measurement. You should only select the values above this value if your signal changes quickly and requires less accuracy (or if there is an extremely good and short cable to the sensor).
AIO analog outputs for voltage
Our AIO voltage outputs are “single ended”, i. e. one of the two connections represents a common ground for both input channels. However, this ground is galvanically isolated from the input ranges and also from the PiBridge and the RevPi Connect power supply. The numerous voltage ranges offered in PiCtory in addition to the classics 0 to 10 V and -10 to +10 V make the module suitable for a wide range of actuators. There is an additional 10% extension for each voltage range so that the limit ranges can always be reached even with inaccurate actuator inputs or long cables.